
Automated Support & Resistance Levels
Algorithmically computed levels for stocks and crypto, recomputed nightly from deep price and volume history - on your TradingView charts and the FrogOracle web portal.
Web portal and TradingView support · from $12.49/mo
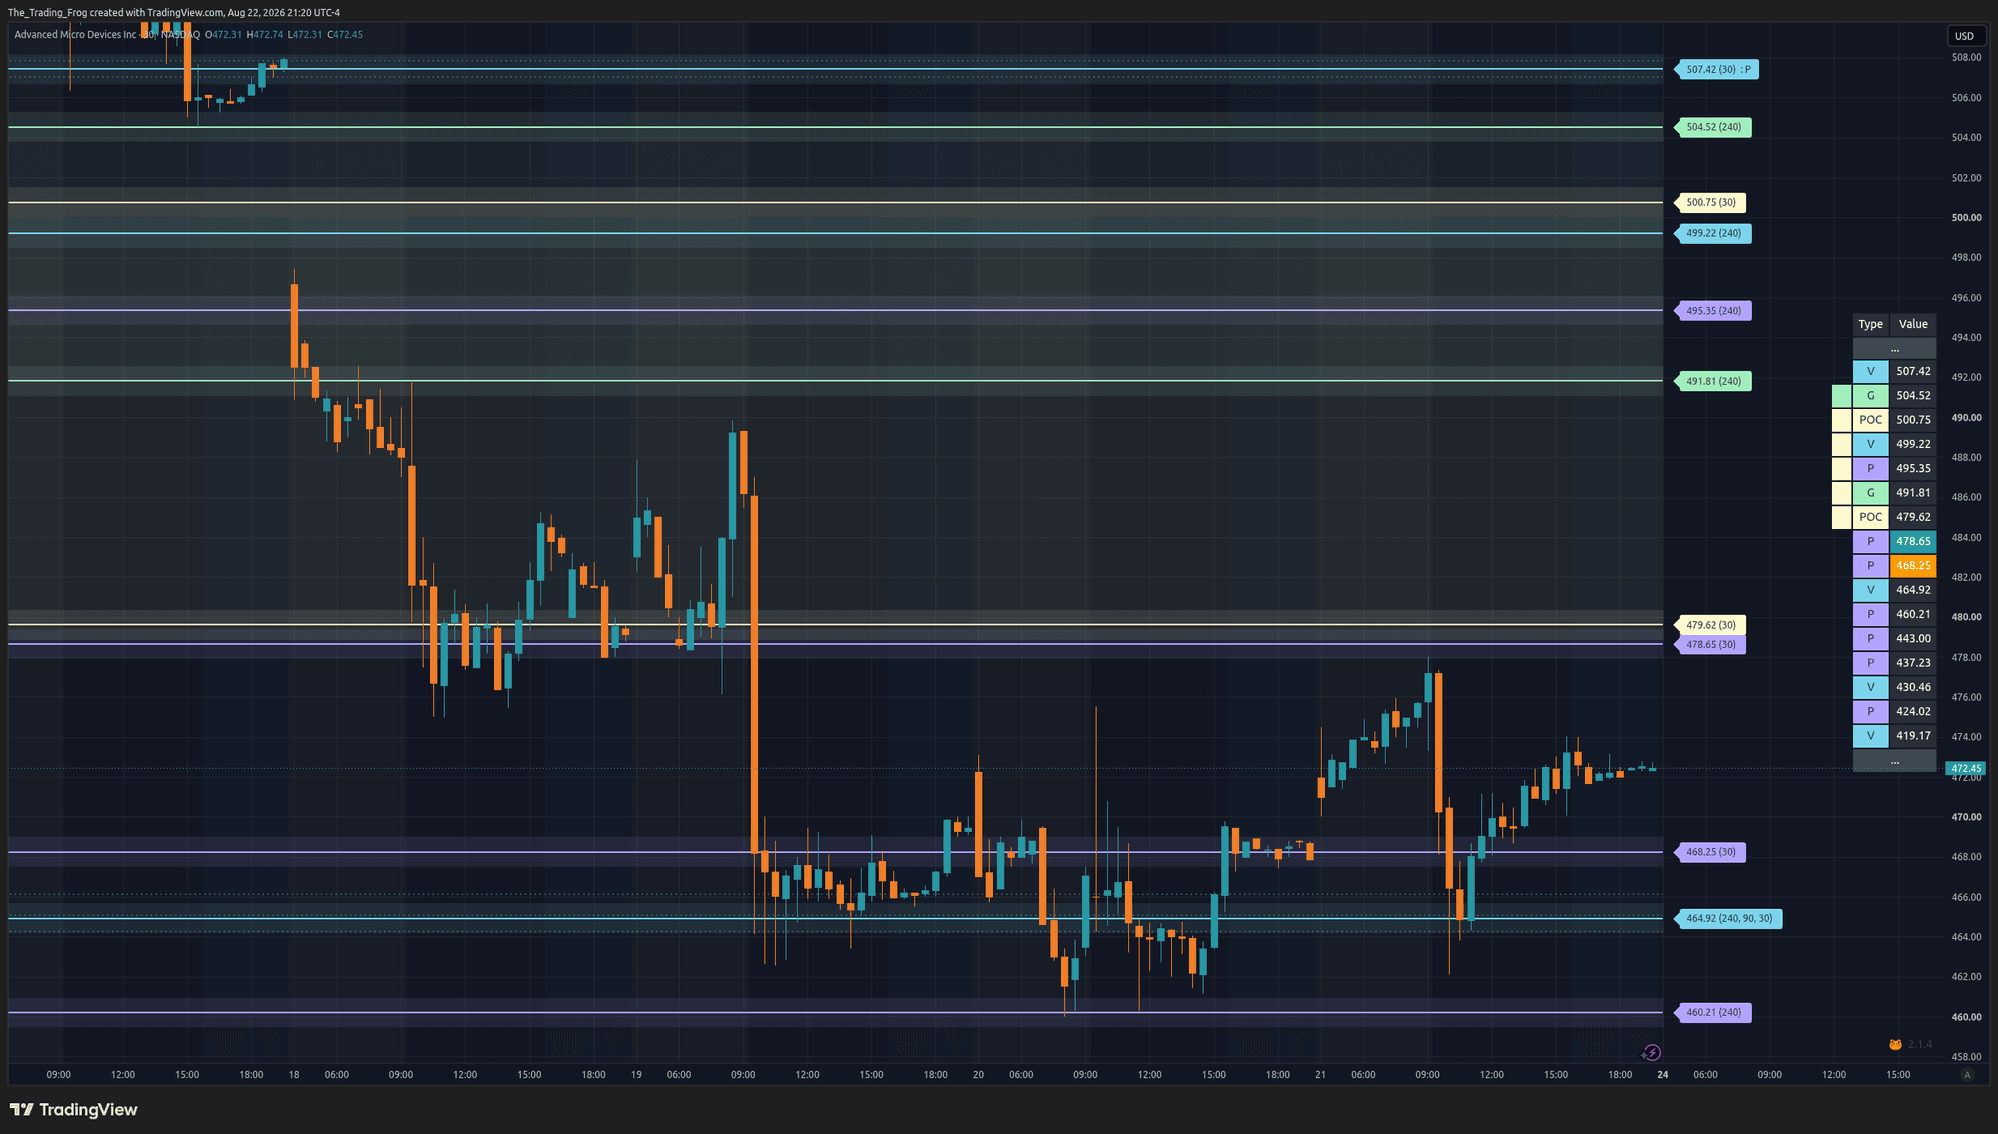
Identify Key Levels
Every important level on one chart: key volume points, points of control, gaps, pivots, previous-day OHLC and psychological levels - computed nightly from vast amounts of price and volume data, far beyond what a chart-side indicator can process.
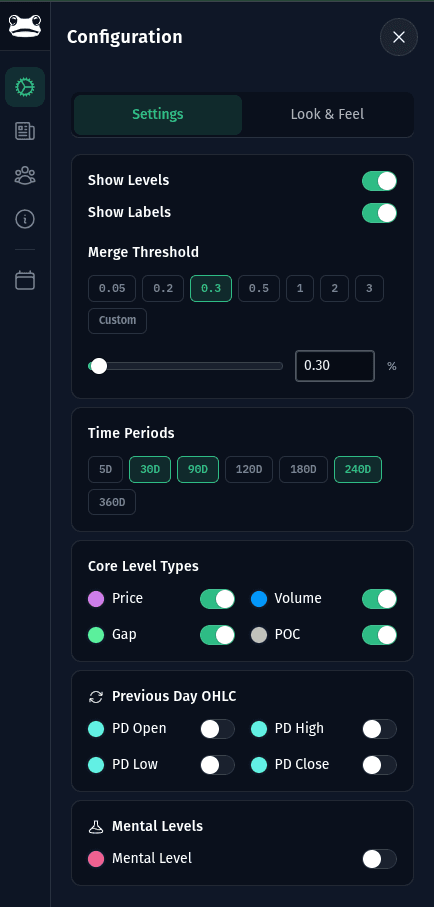
Make It Yours
Toggle level families, filter analysis periods, tune the merge threshold with presets, and recolor everything. Your configuration is one tap away on every chart, in the portal and on TradingView.
Not just levels - proven setups
The levels are the foundation. Over years of use, a set of repeatable strategies has emerged around them - each documented with real examples.
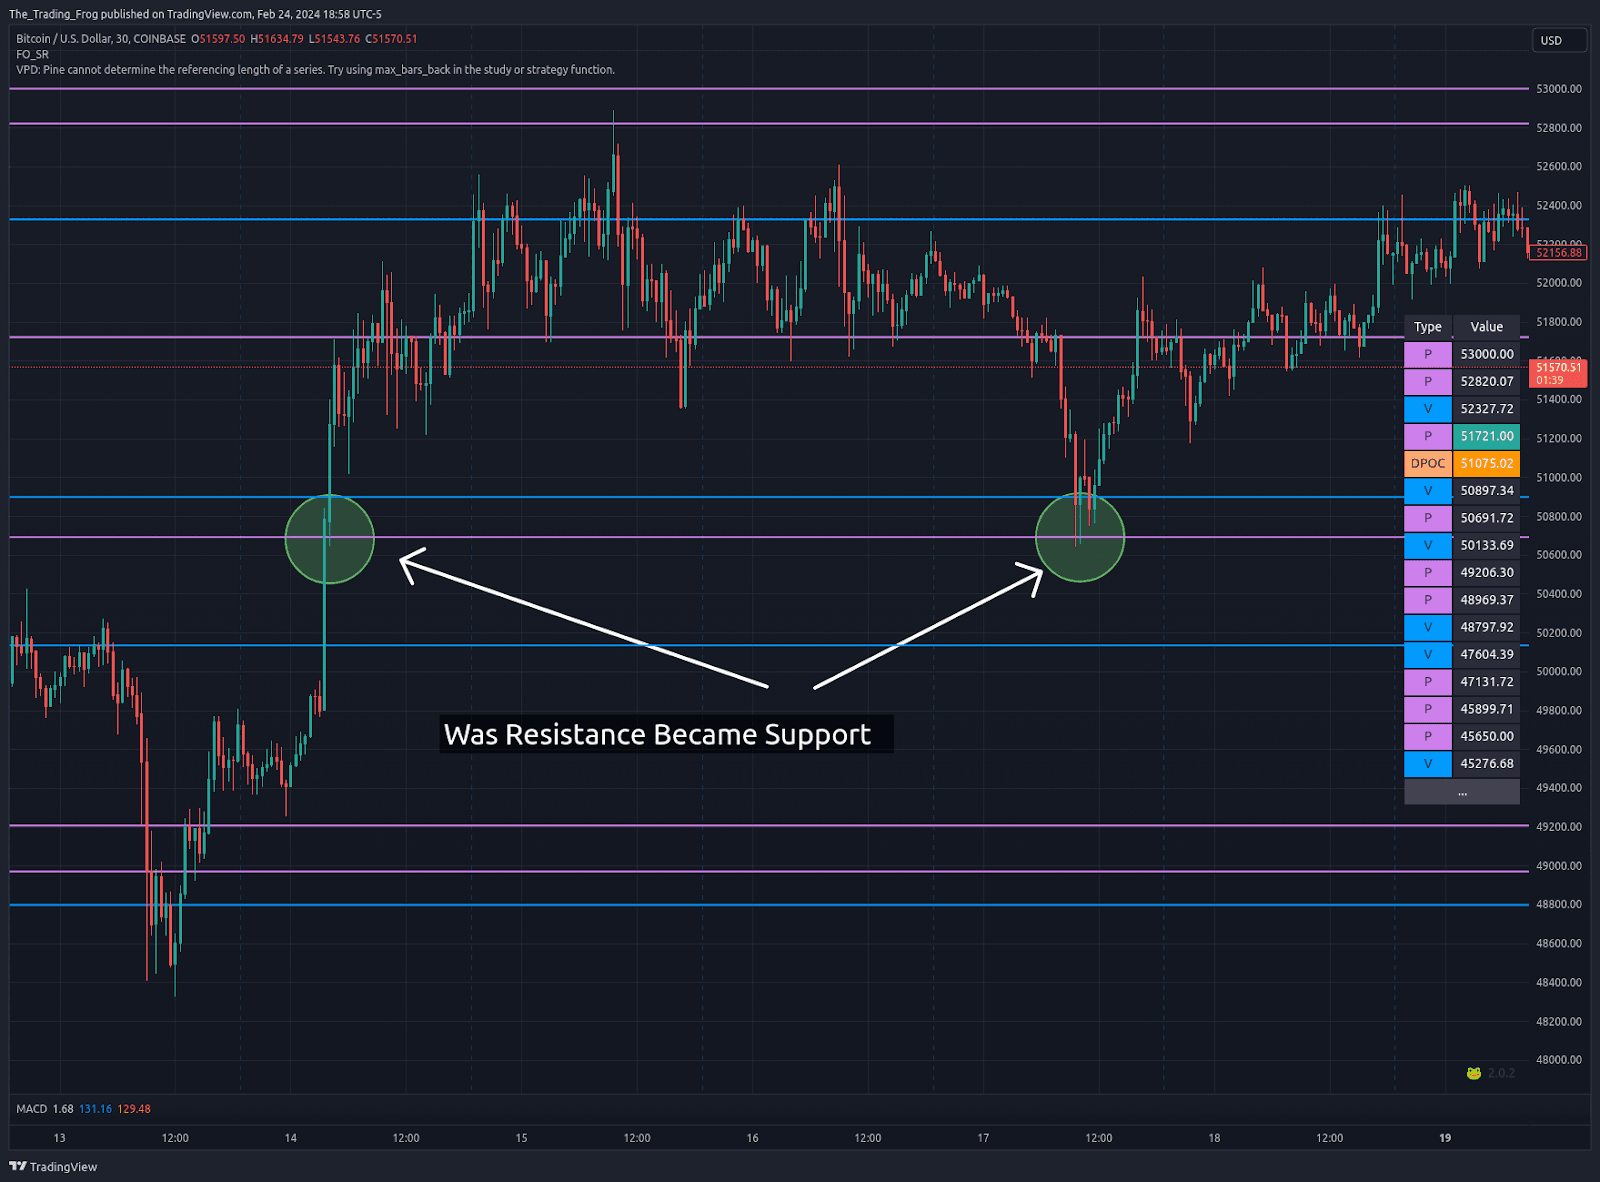
Support Becomes Resistance
SBRThe flagship setup - a critical level flips role after a decisive break. Works long and short.
Read the setup →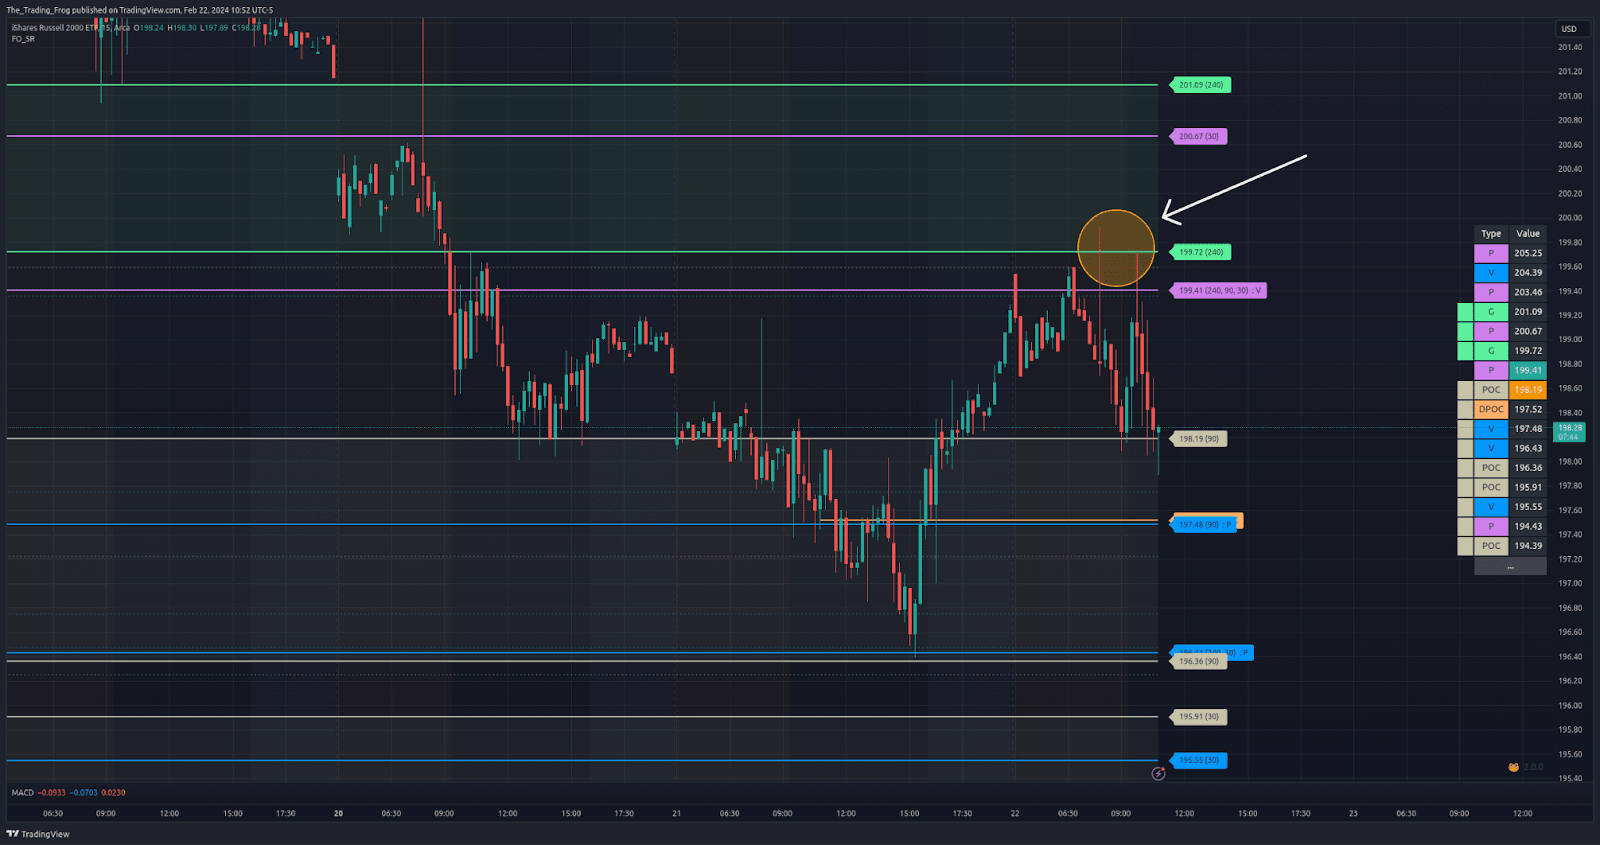
GAP Rejection
GRPrice approaches a gap, dips inside, then reverses hard in the opposite direction.
Read the setup →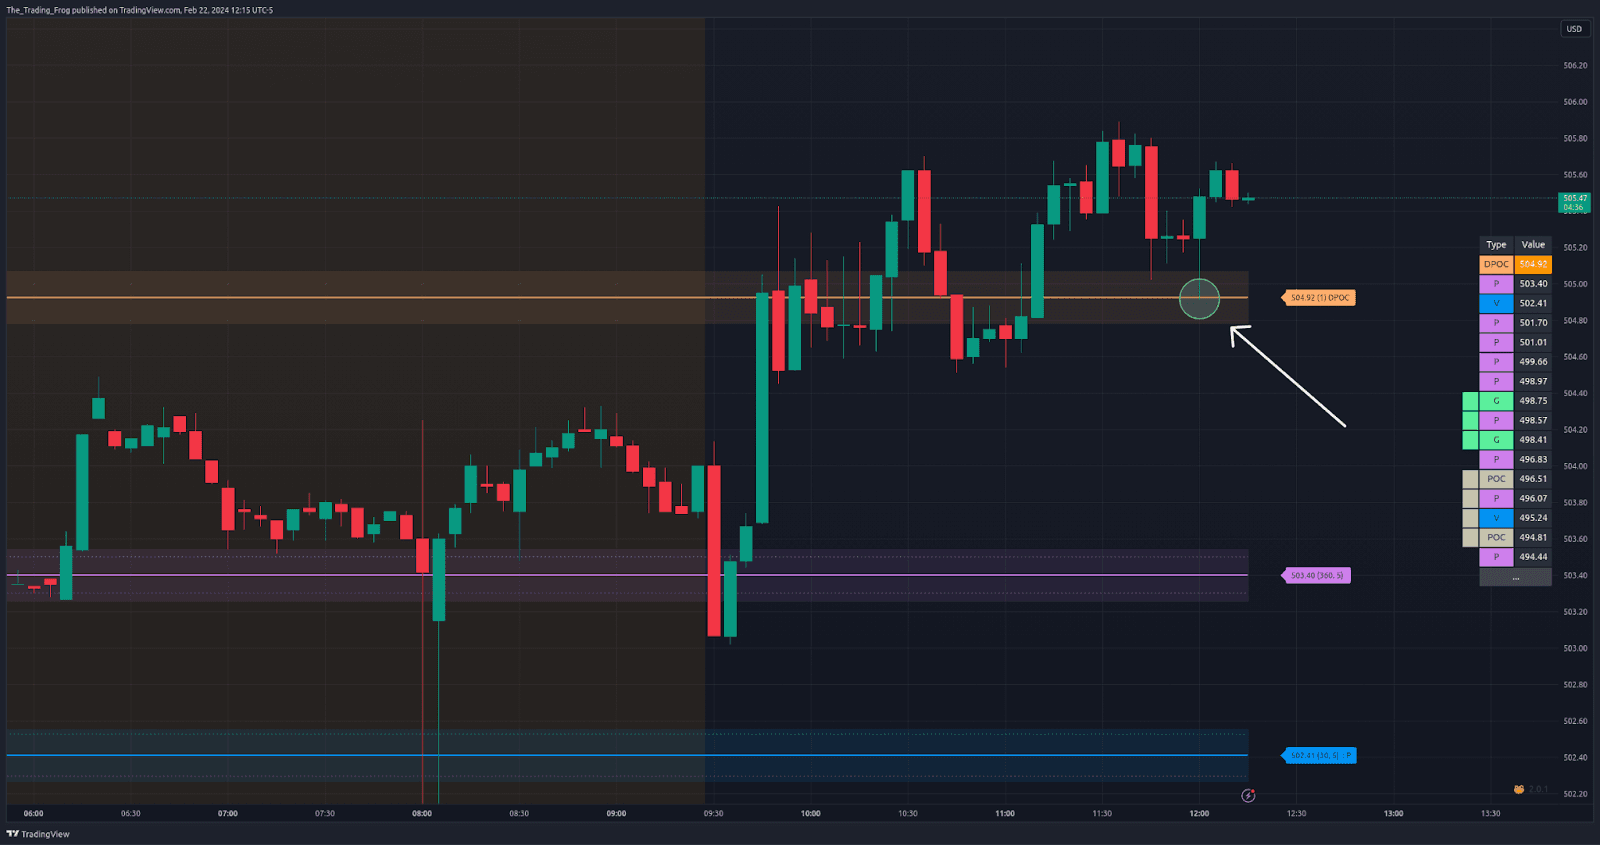
DPOC Bounces
DPOCBThe recent point of control defends itself as prior participants protect their positions.
Read the setup →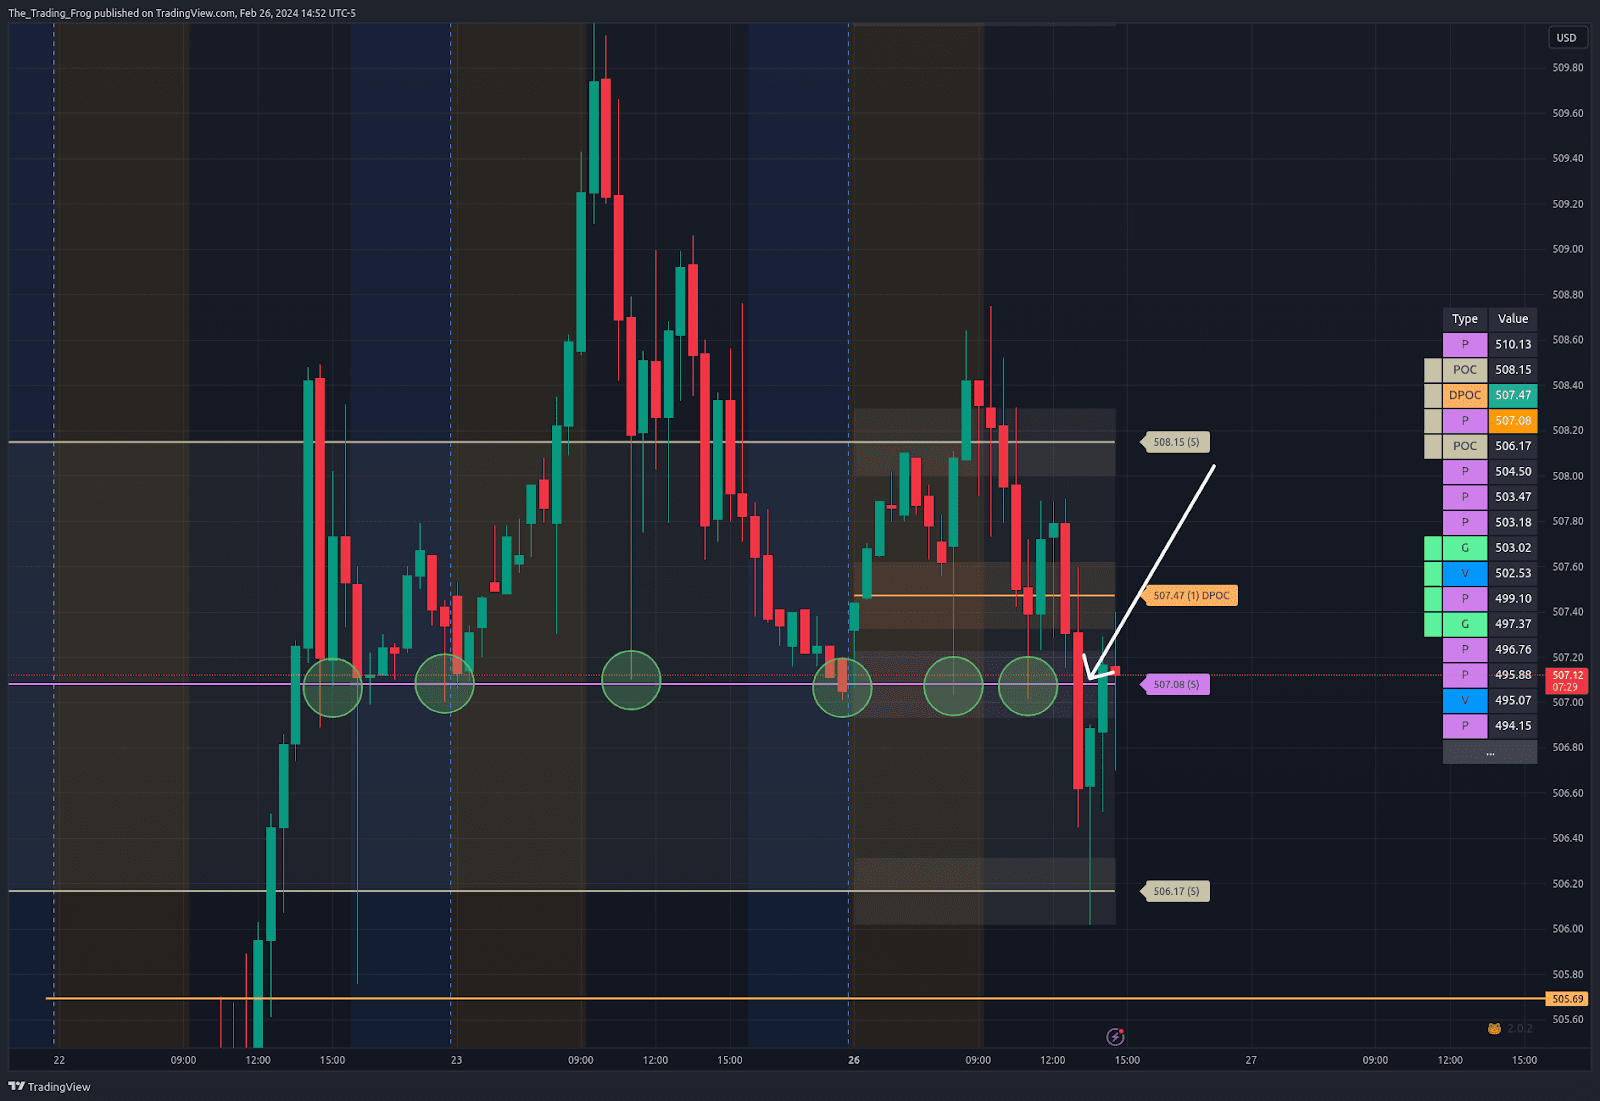
Final Stand
FSA much-tested level finally breaks - trade the break with a tight stop above the level.
Read the setup →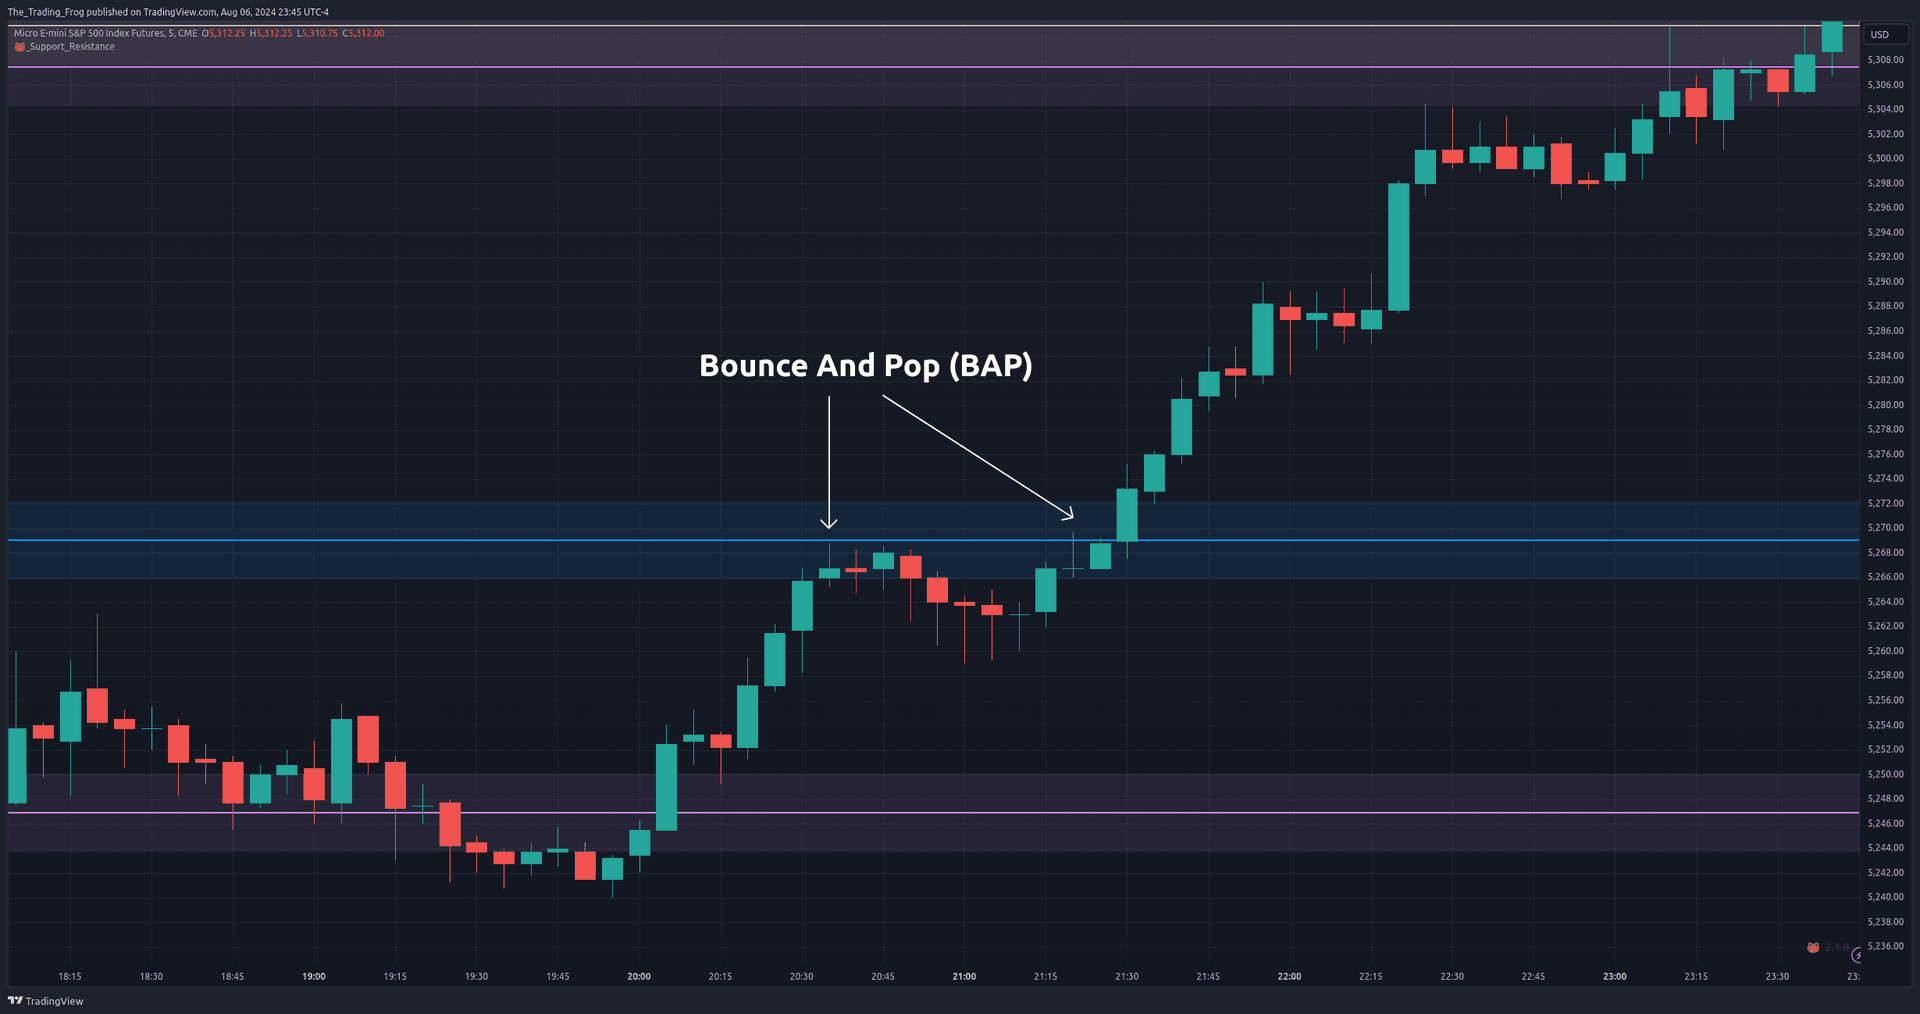
Bounce And Pop
BAPA level with repeated clean rejections becomes a high-probability reaction zone.
Read the setup →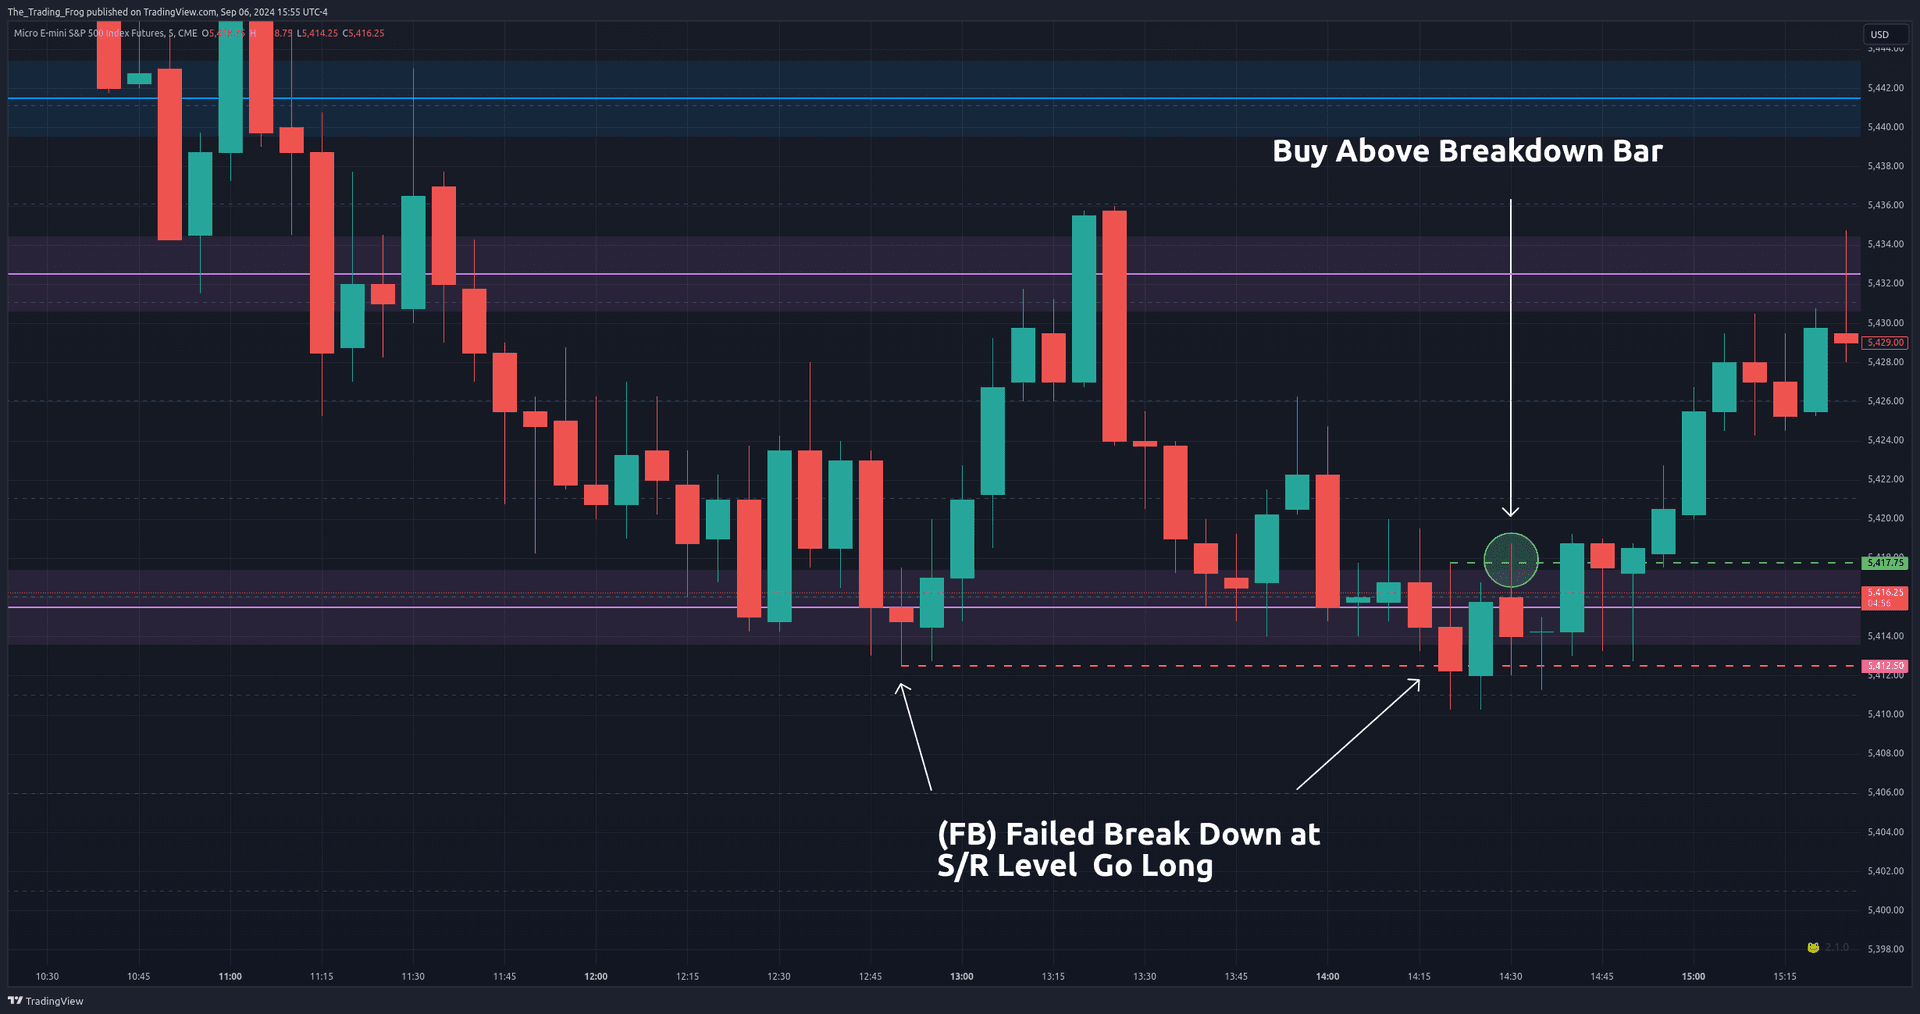
Failed Breakdown
FBA false move beyond a level snaps back, trapping traders and fueling the reversal.
Read the setup →Broad Ticker Support
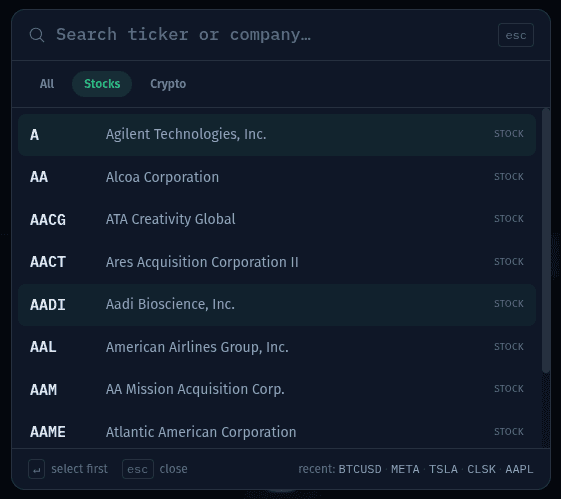
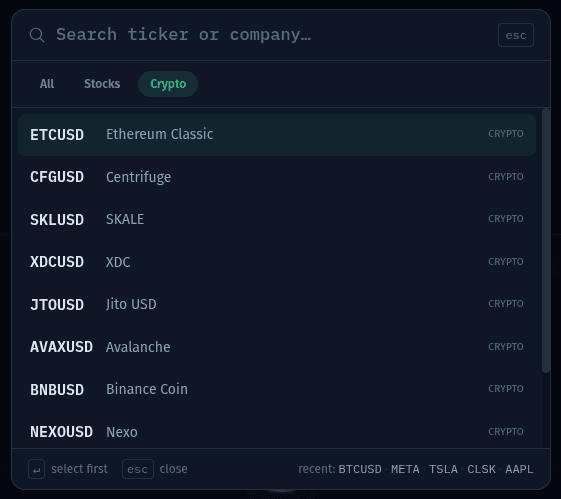
S&P 500 names, ETFs, small caps and hundreds of crypto pairs - the same clean levels across every asset class, with live tick streaming in the portal. If a ticker you trade is missing, ask and it gets added.
Included Volume Profile
Every subscription includes a volume profile built from lower-timeframe data, so the shape of participation behind each level is never a mystery. See exactly where the market did its business.
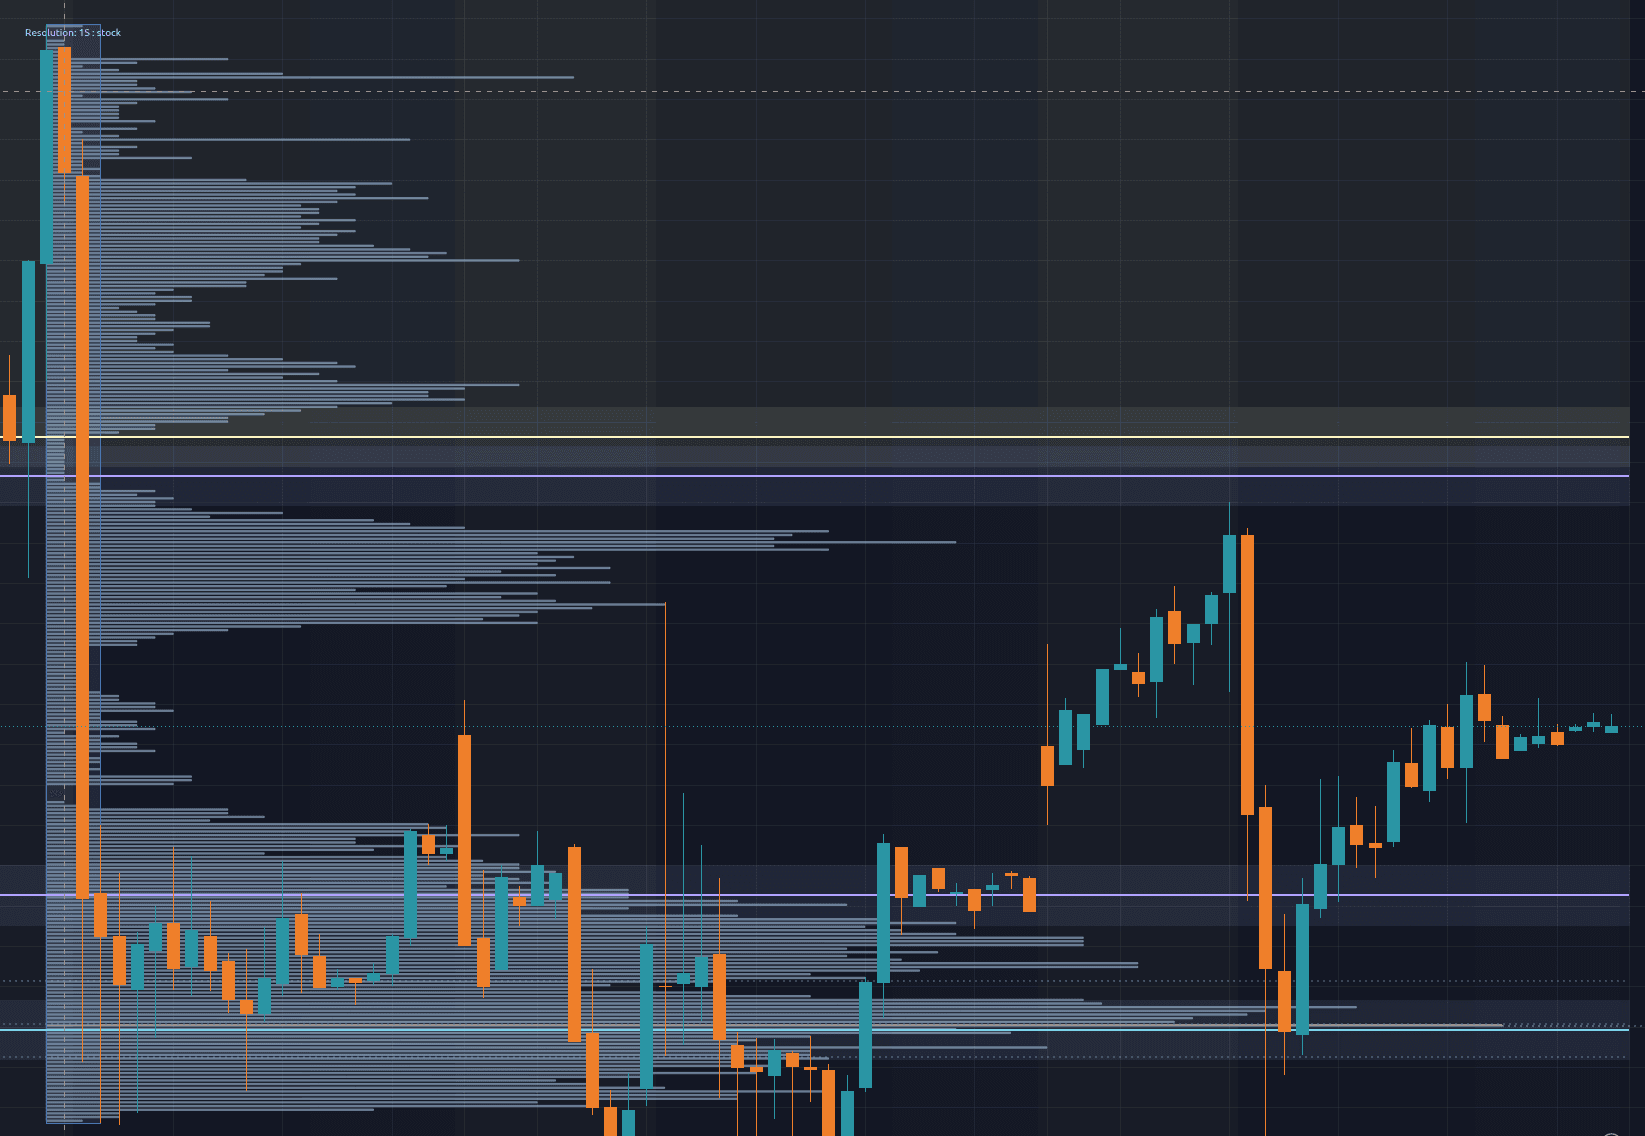
Chart From Anywhere
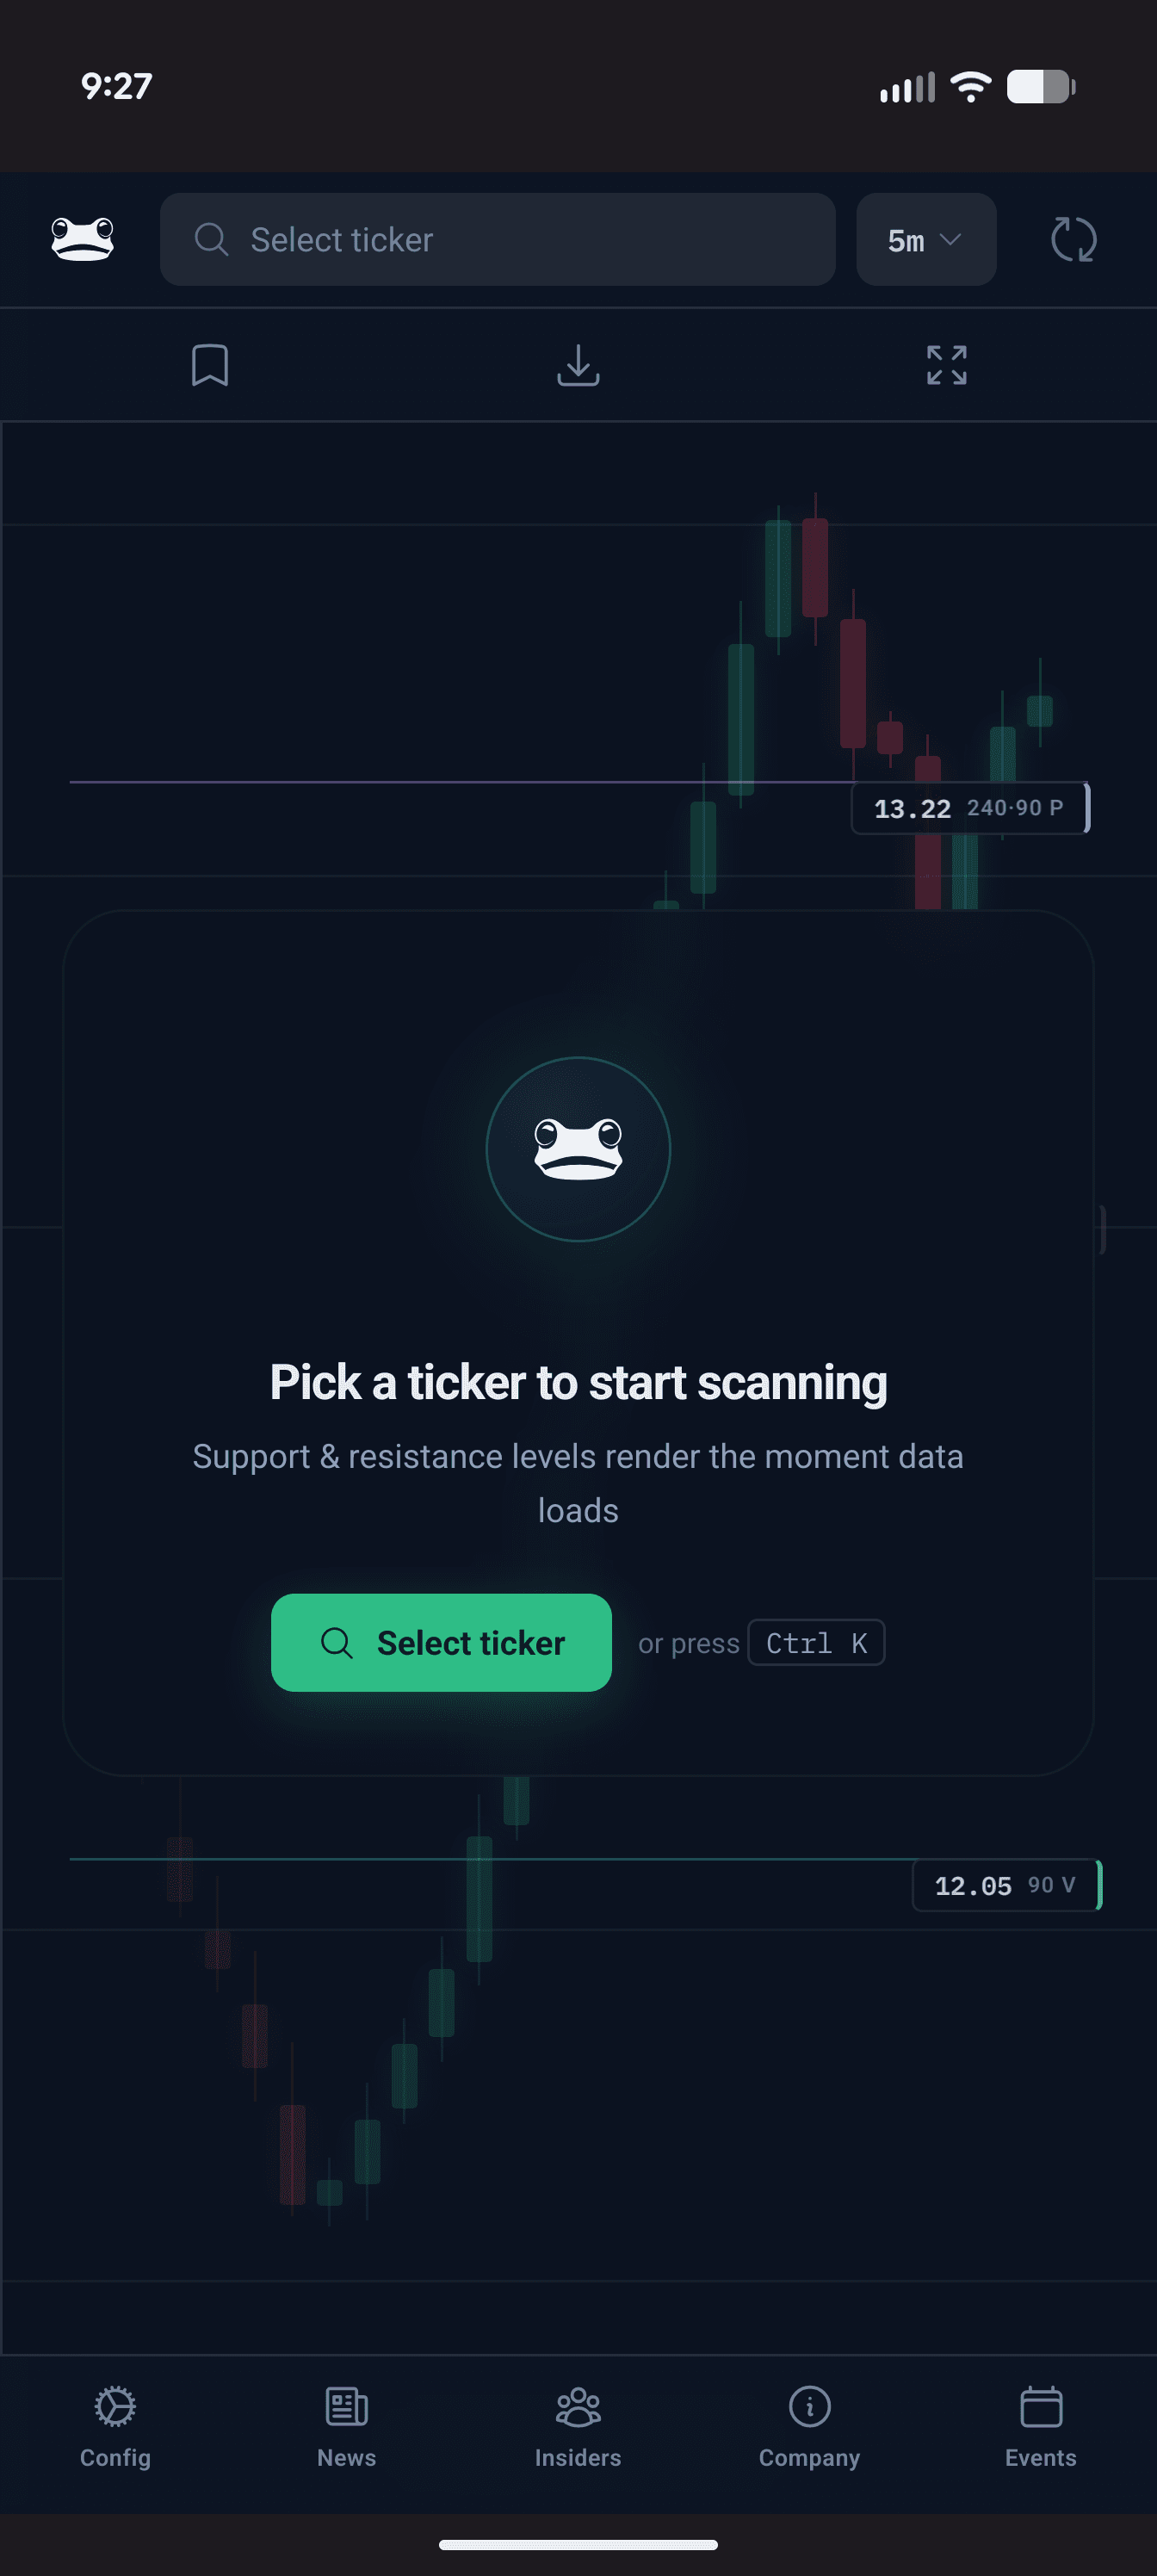
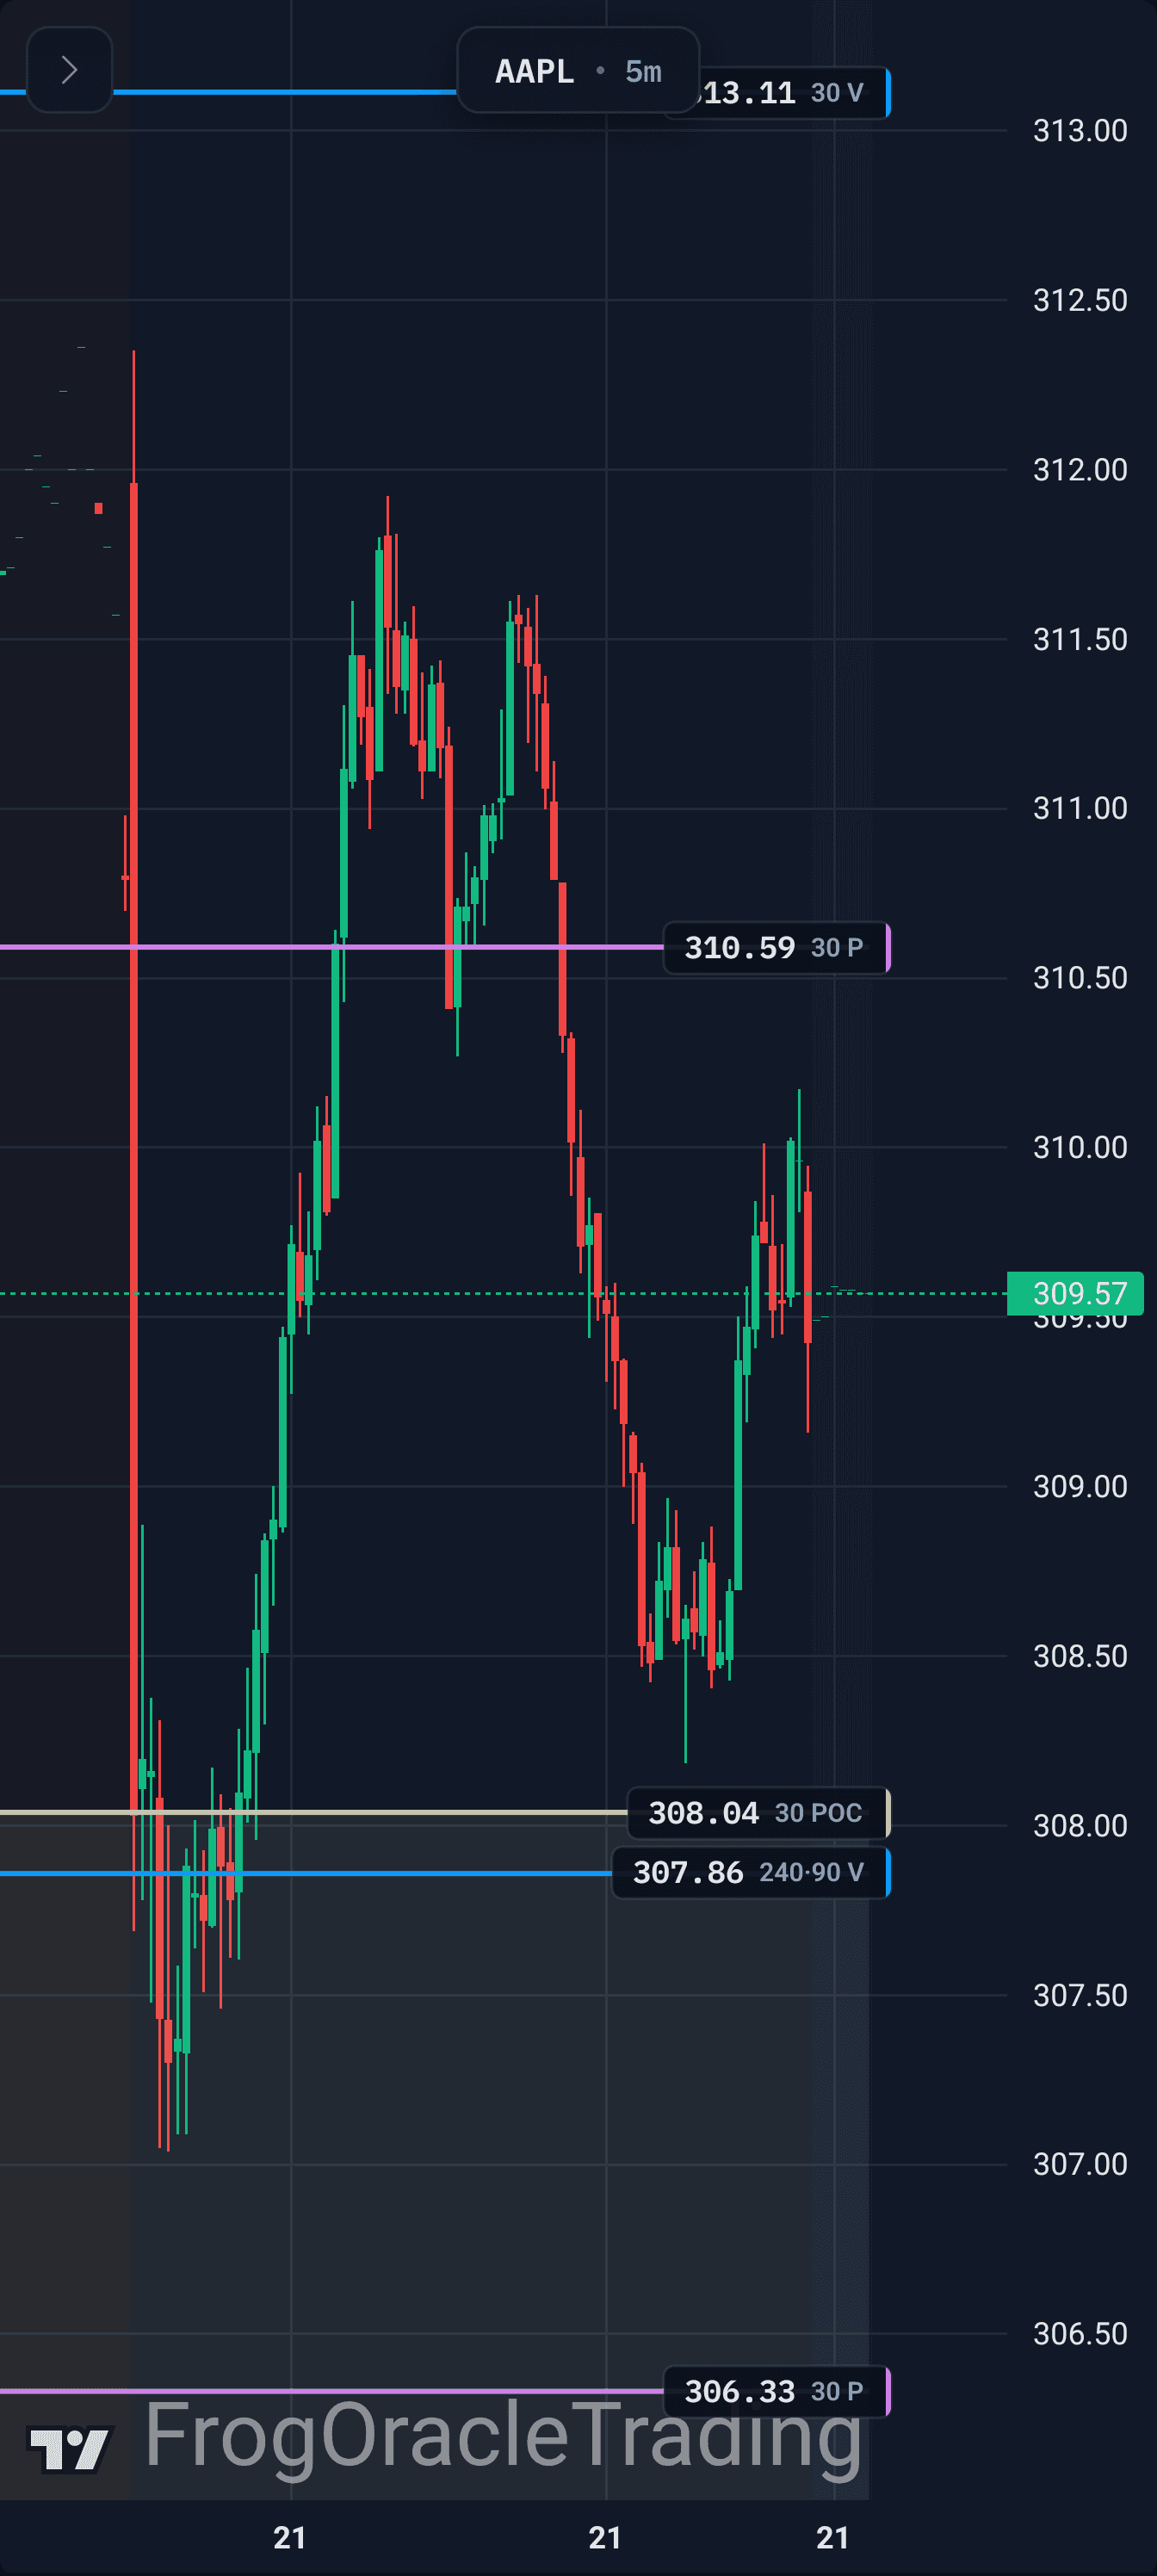
The web portal is fully responsive. Live levels, live ticks, watchlists and company data on your phone - the chart takes the whole screen, controls tuck away when you don’t need them.
Used daily by real traders
“I’ve been searching for years to find different indicators for my technical analysis. I stumbled upon this indicator, and it is THE indicator. Every important level is on the chart from key volume points, pivot points, gaps, and even psychological levels. It’s extremely clean and easy to read.”
“The intraday, 30, and 240 s/r are incredibly useful. When levels coincide it presents great opps for entry and exits. Overall, I’ve determined you save me 15-20 minutes/day, which adds up quick.”
“The ability to gauge support and resistance levels is an important skill for any trader. With your well designed mechanisms and visuals I can focus on timing, risk/reward and trends. Your indicators are now a permanent fixture on my main trading display.”
Take Your Trading To The Next Level
Levels recomputed every night. Live ticks in the portal. Proven strategies to trade them.
Get Access